How to monitor cronjobs in kubernetes with sk8l
8/12/2023Installation
To achieve our goal, we need to install 3 tools: sk8l, prometheus and grafana. We will continue in that order.
sk8l installation
You can install sk8l via helm.
helm repo add sk8l https://sk8l.io/charts
helm repo update

helm search repo sk8l

helm show values sk8l/sk8l

helm upgrade --install [RELEASE_NAME] sk8l/sk8l \
--set namespace.name=[NAMESPACE] \
--set serviceAccount.metadata.namespace=[NAMESPACE]
sk8l configures the pod and containers as secure as possible so there are some settings that you might want to take a look at and configure if neeeded via the cli or by creating your own values.yaml.
- namespace:
You can create a namespace where you want to run sk8l in via the helm chart withnamespace.createNamespace. If you chose to, you can passnamespace.labelsin case you want to enforce security policies at a cluster-level to ensure all pods in the namespace meet the security standards via the the PSS and PSA controllers. - networkPolicy.uiPolicy:
sk8l-api only allows traffic from the containers running the user interface. - networkPolicy.apiserverPolicy: The sk8l-api pod needs to be able to reach the api-server and therefore you need to restrict the values for
ingress.from.ipBlock.cidrandegress.to.ipBlock.cidrappropriately. - configMaps.ui.vue_app_sk8l_api_url: The frontend needs to know how to reach envoy. The default value is
localhost, so you only need to change this if you want to reach sk8l on another address. - secrets:
kubectl create secret tls -n NAMESPACE tls-ca-cert --cert=ca-cert.pem --key=ca-key.pem
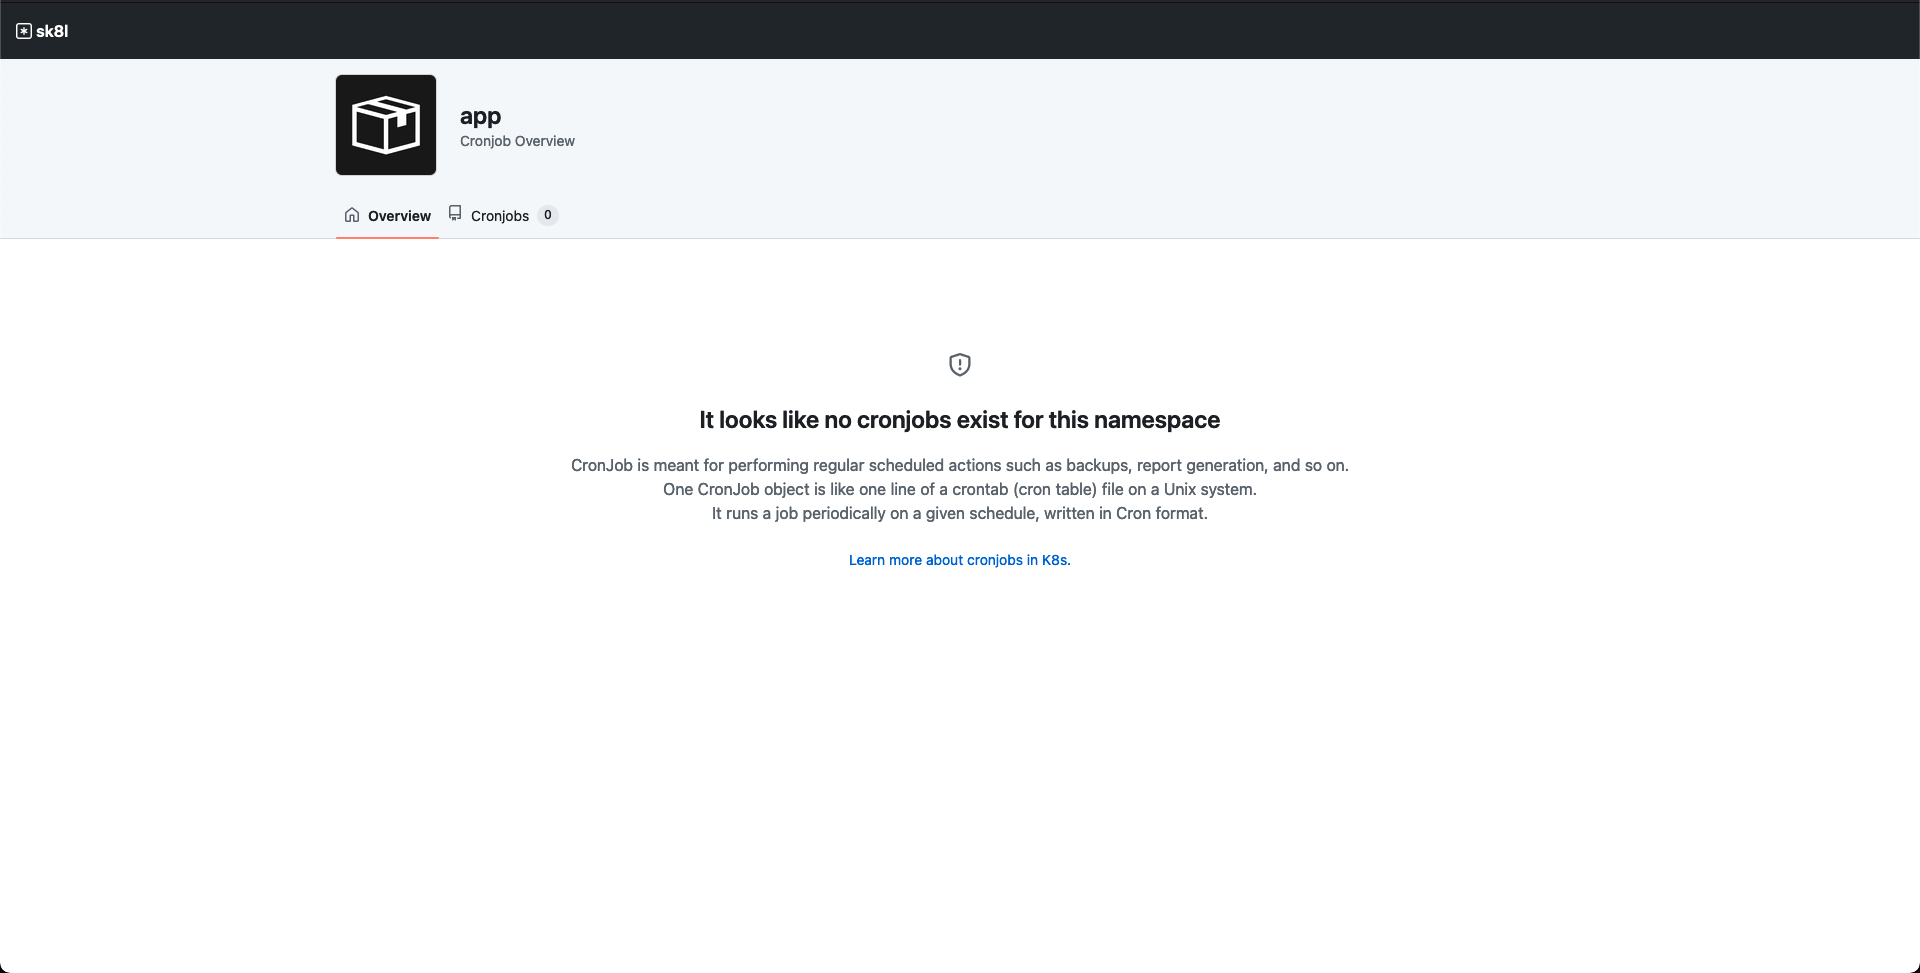
kubectl create secret tls -n NAMESPACE tls-server-cert --cert=server-cert.pem --key=server-key.pemAfter configuring and installing the chart, sk8l should be seeing an screen similar to the following running at https://localhost:8001.
If there are no cronjobs currently configured to run on the same namespace as sk8l, thet that page will look very empty with only a hint message.
You probably want to see sk8l in action, so add an example cronjob with the following code:
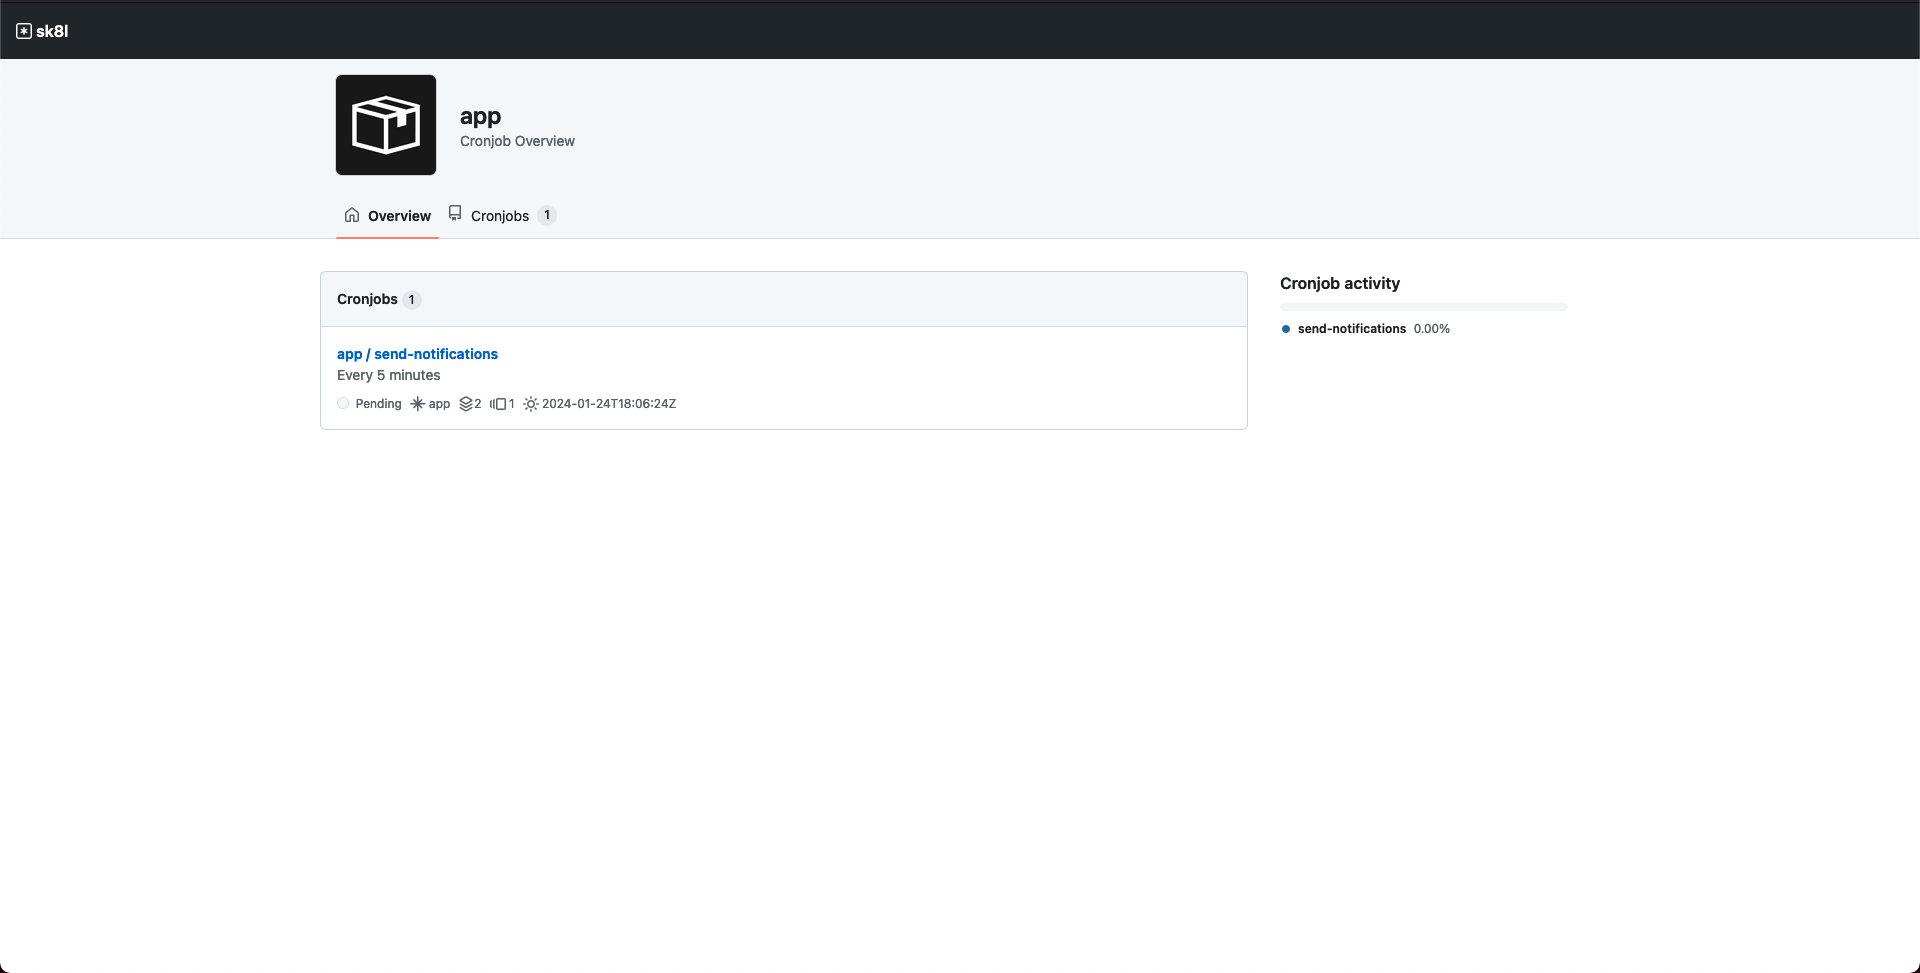
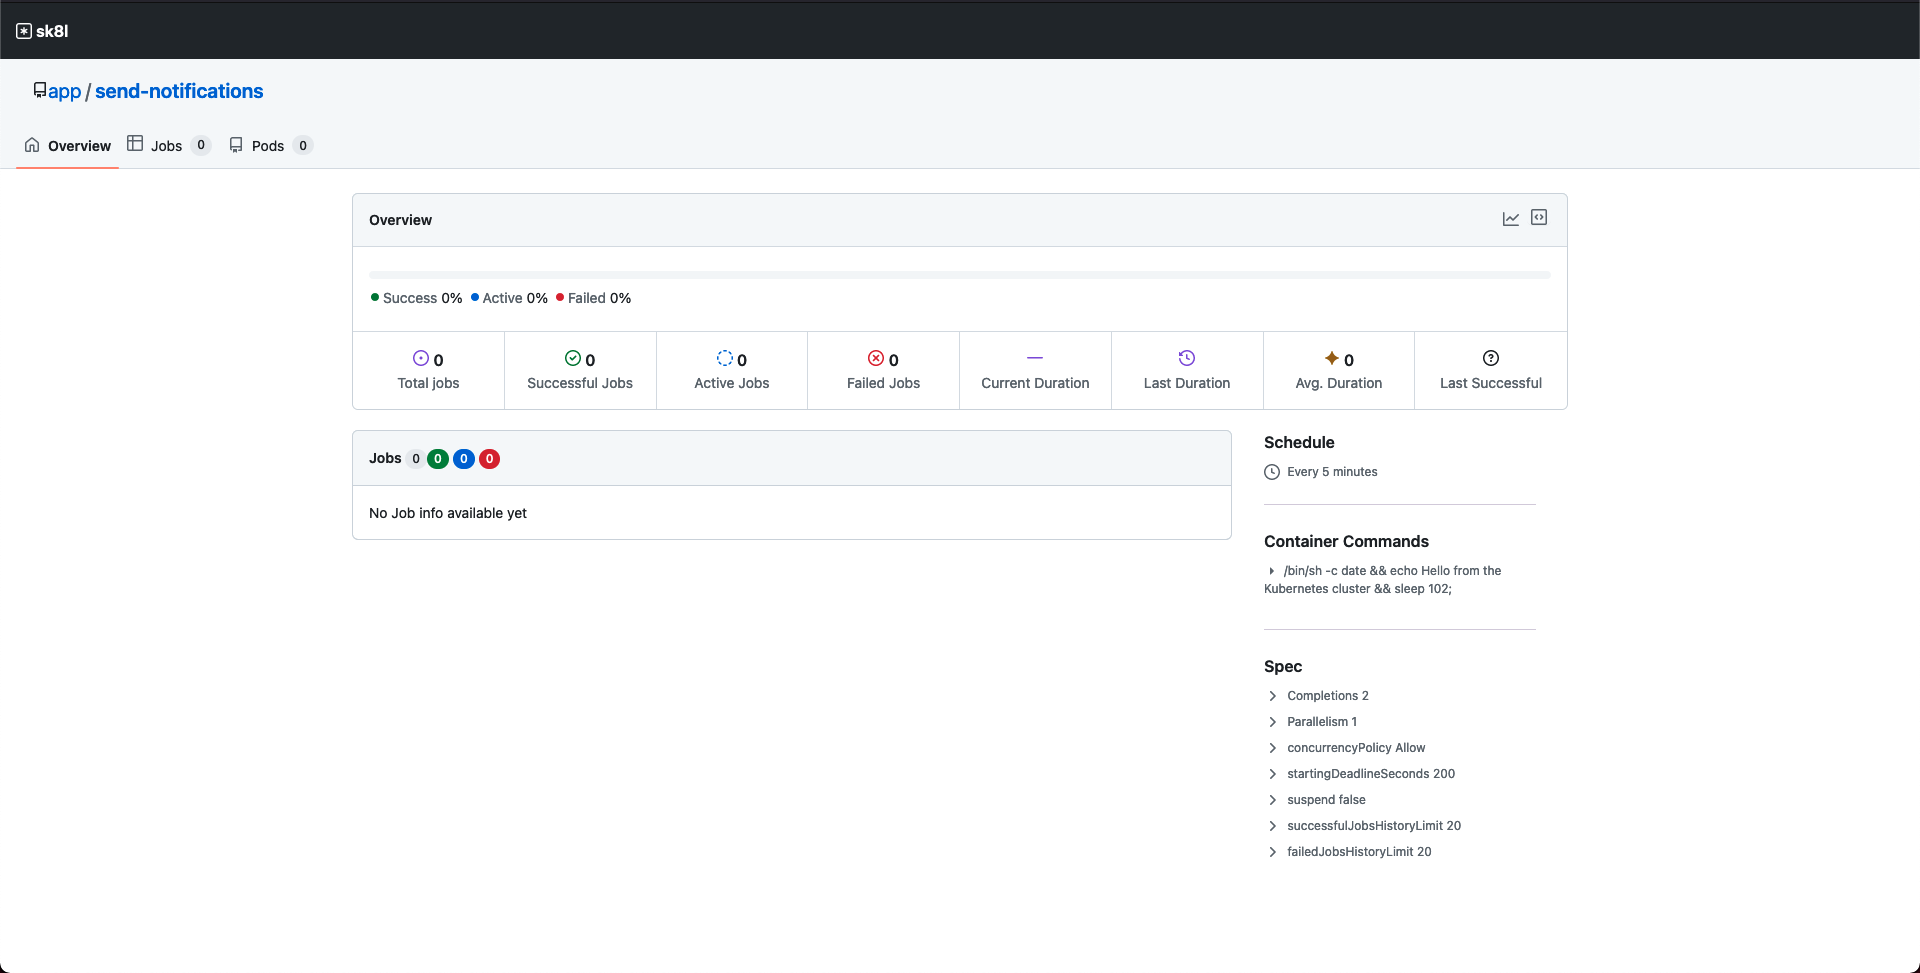
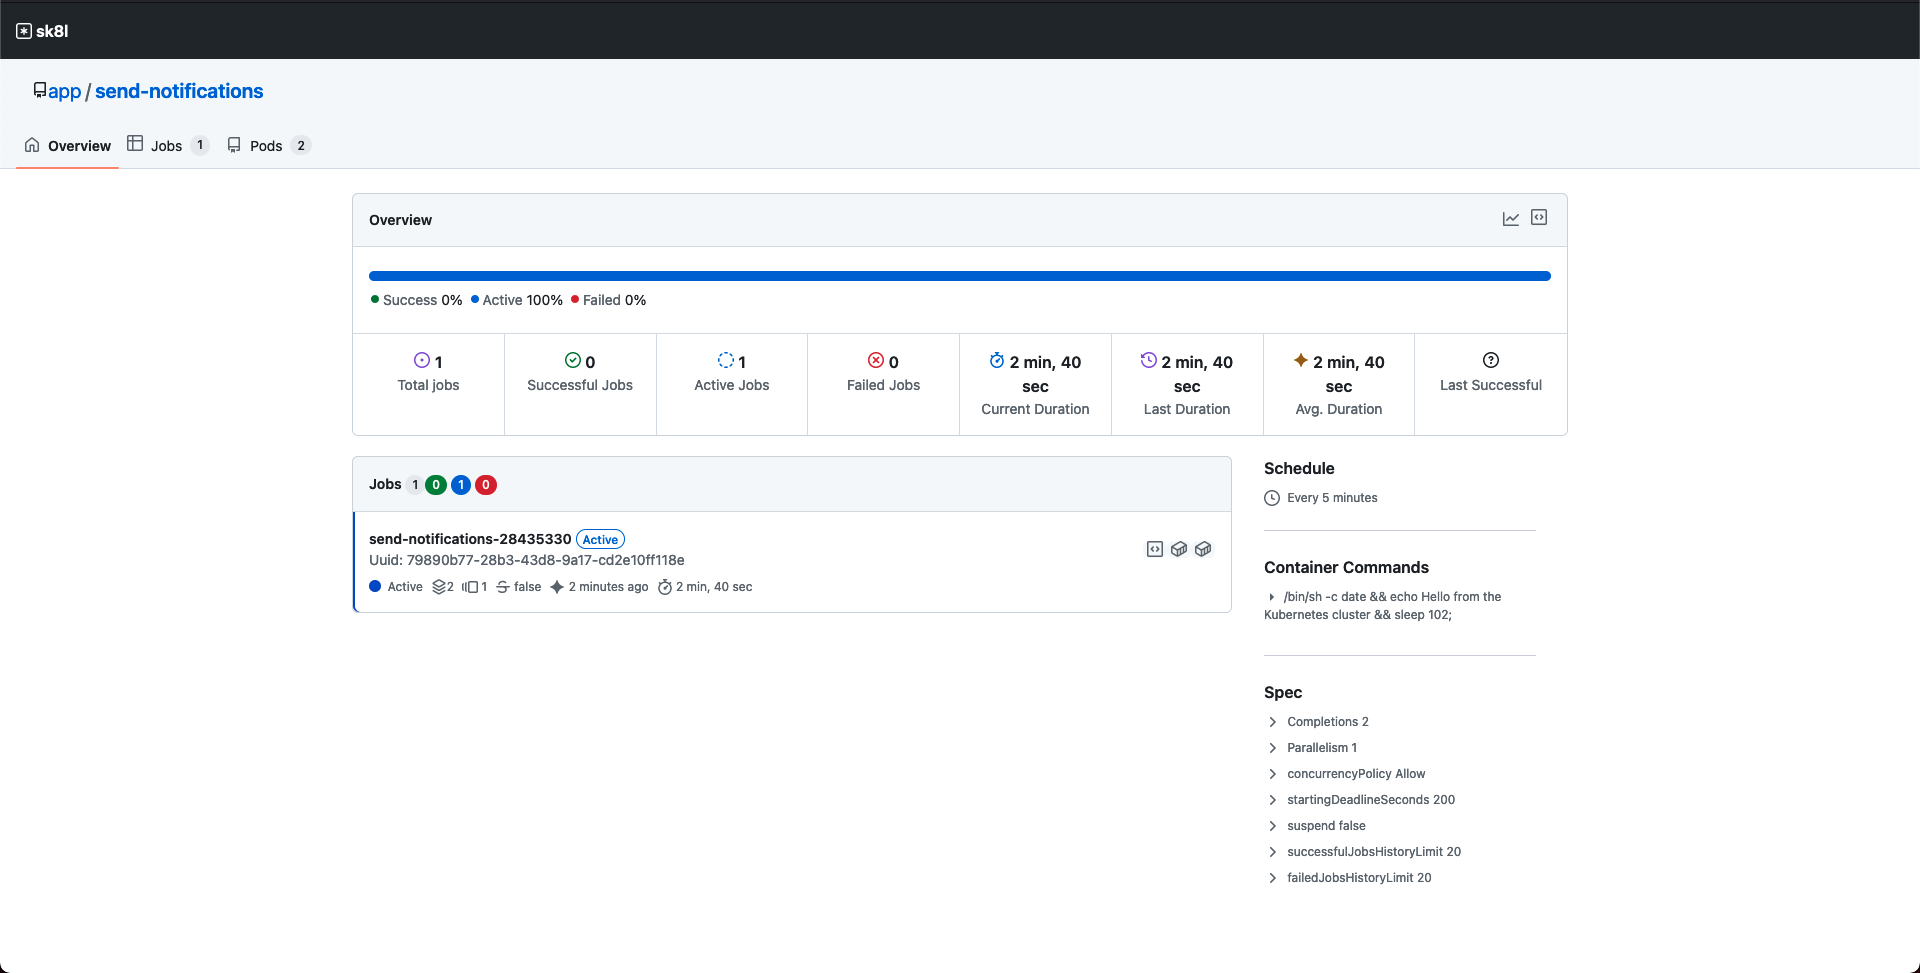
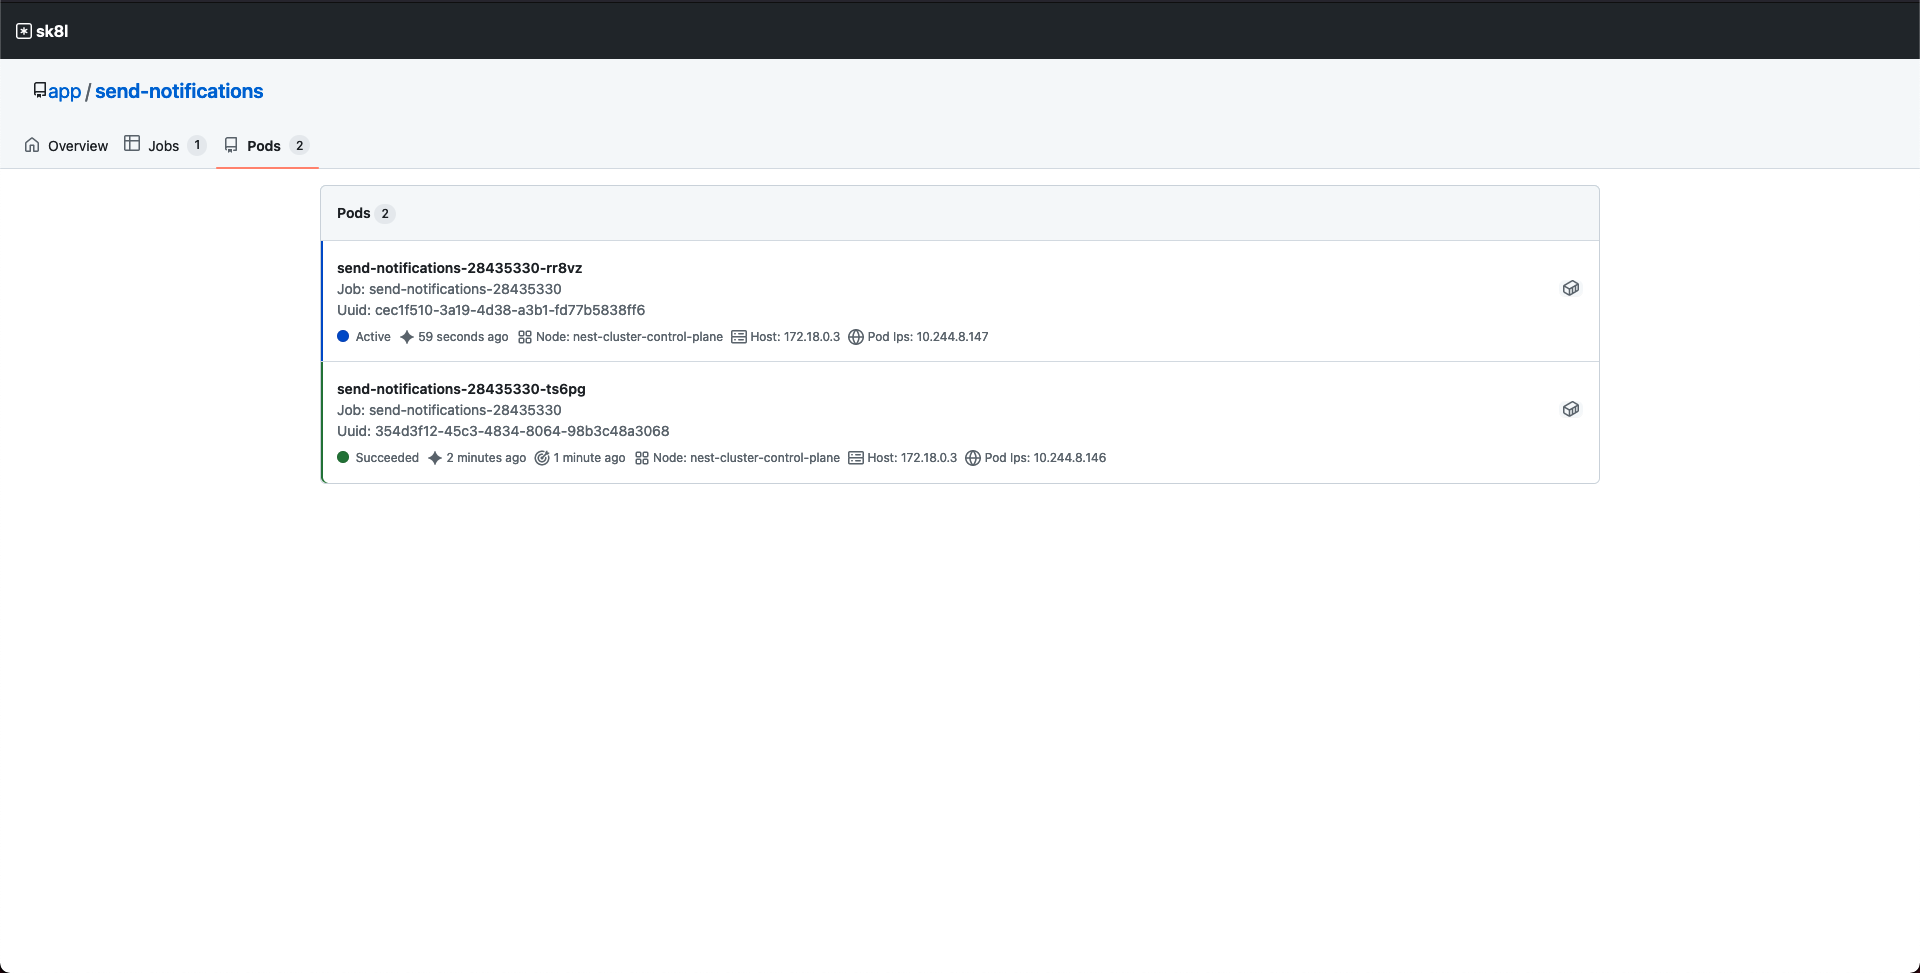
Now that you have a cronjob configured and while you wait for some jobs to be done, you can click around to see all the information sk8l displays about a cronjob and job executions.
This is pretty cool(if i say so myself) but cooler is to see all the data available on some charts. For that we need to configure prometheus and grafana and that’s what we’re going to do next.
Prometheus
There are different ways of how to install prometheus and how to do it depends on how you want to run it. In this section I’m going to give you some pointers on what needs to be configured and how to do it in case you chose to run it inside kubernetes.
TLS certificates
sk8l exposes a /metrics endpoint on an HTTPS port, therefore you need to make the server and ca certificates available to prometheus too in order for it to secure the communications between both applications.
Secret management is a big topic and there are multiple ways to handle them in your applications. Since we created the tls certificates above as secrets directly via kubectl, we are going to keep doing the same here. We create a deployment and mount a volume with both files to the pod running prometheus.
NetworkPolicy
As mentioned above, sk8l tries to be as secure as possible. Every connection is rejected by default, this is why we need to allow explicitly every connection that needs to take place to and out of its pods. In other words, we have to add a policy to whitelist connections coming from the prometheus pod on their corresponding namespace to sk8l-api on the scrape port(8590).
Scrape jobs
You need to tell prometheus what applications to scrape metrics from. This is done via a prometheus.yaml file on the machine prometheus runs on. We are going to add a ConfigMap to k8s to create a file with the scrape jobs we need to get cronjob metrics out of sk8l.
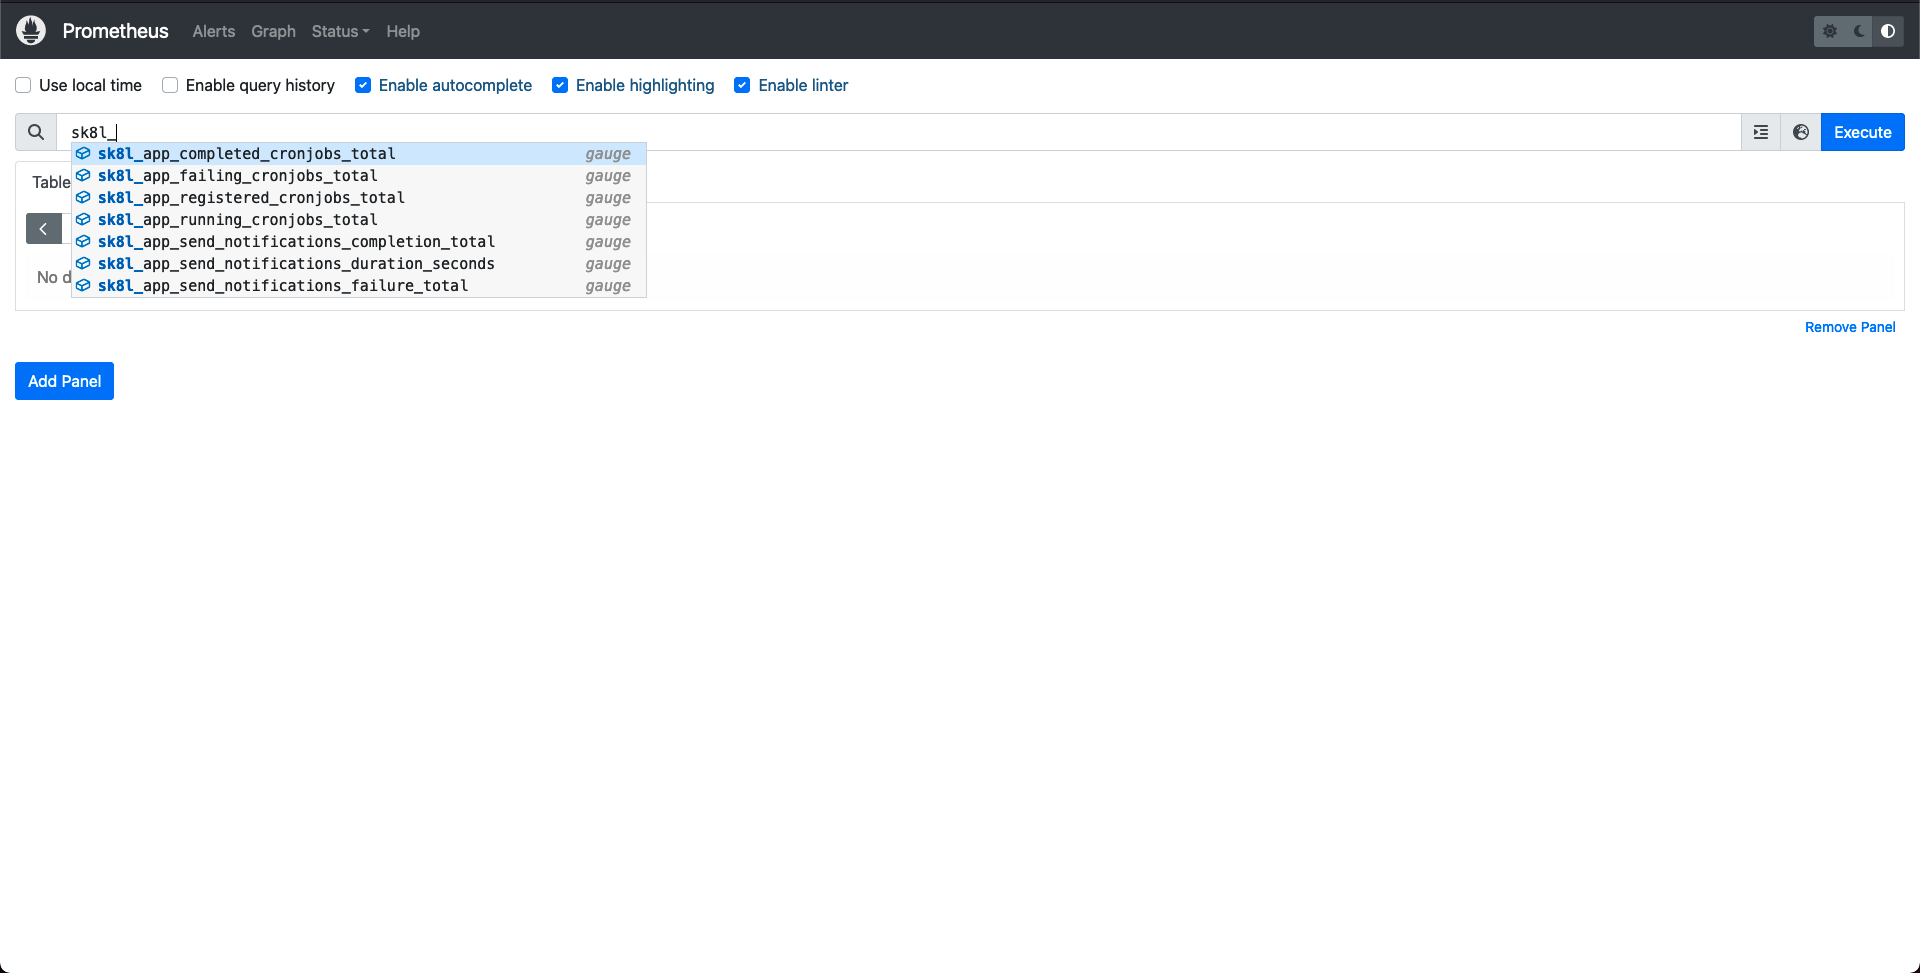
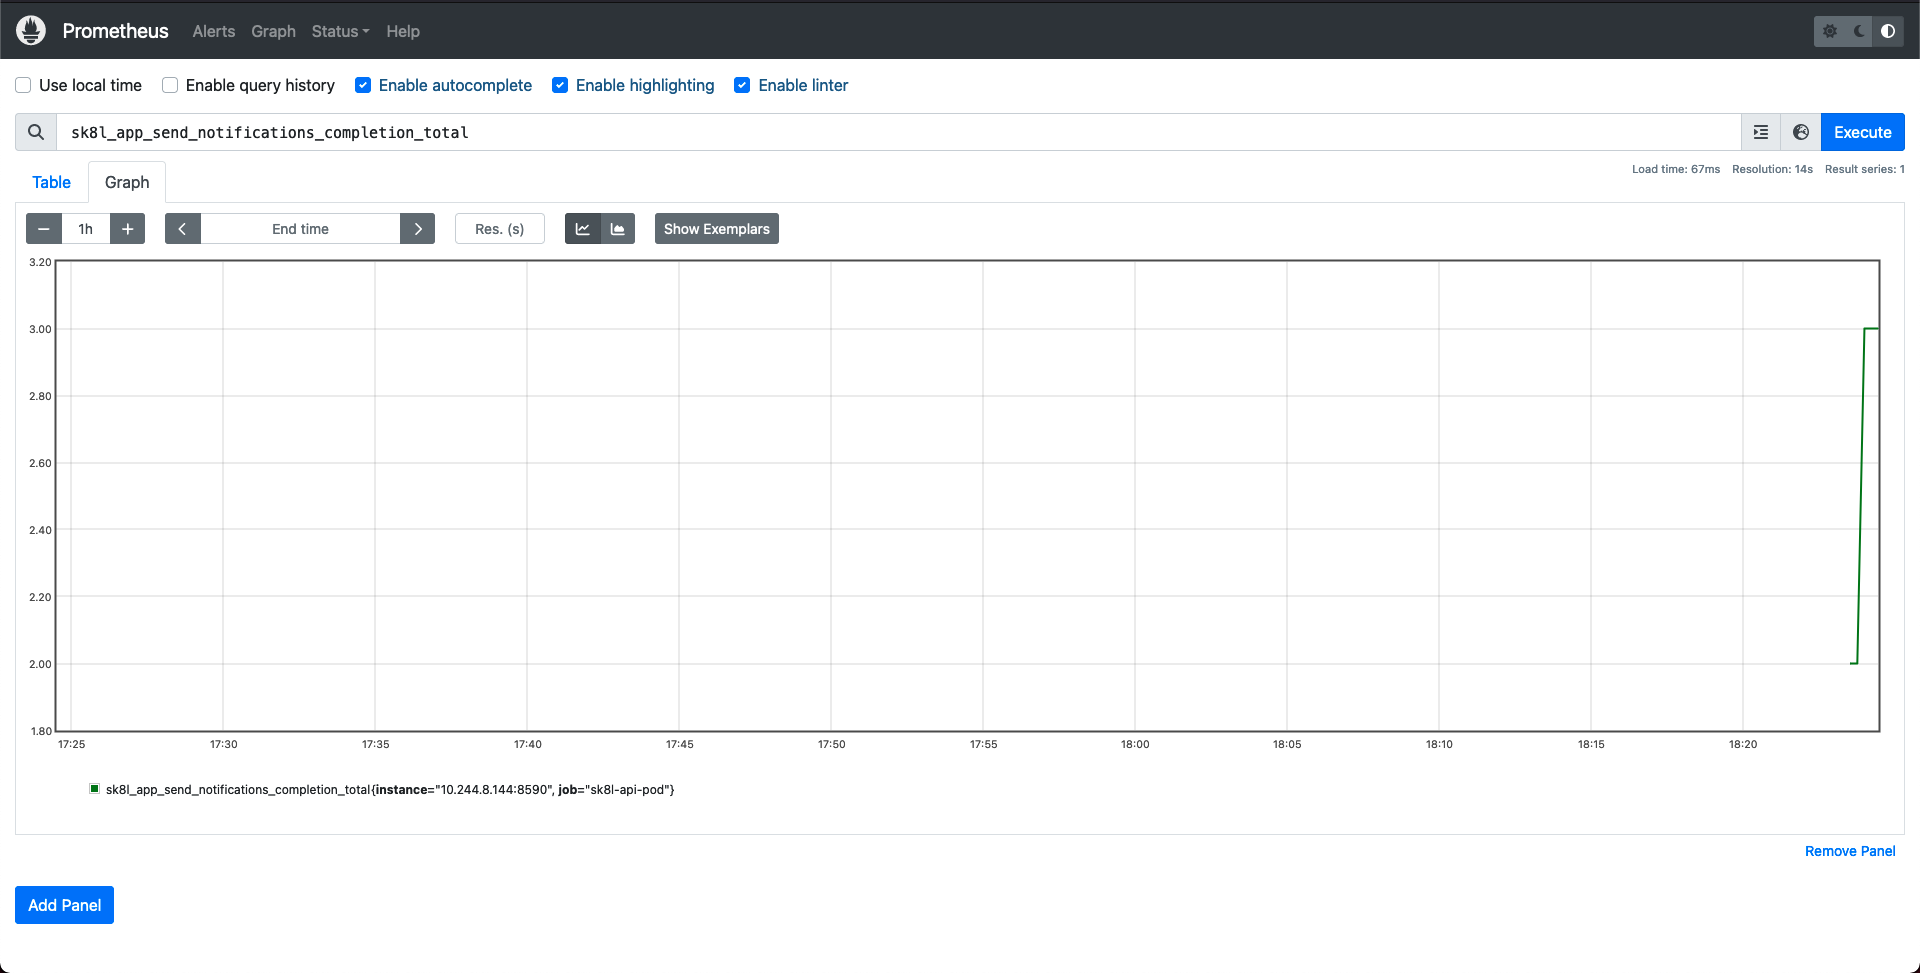
Once prometheus is running with this configuration, it should be reachable at http://localhost:9090 and you could query and even graph data as completed, failing, registered cronjobs coming from sk8l on http://localhost:9090/graph, just type sk8l or the namespace you’re using on the search field.
Grafana
We continue now with grafana, which will help us see all the data in better looking dashboards.